FISH-BONE DIAGRAM
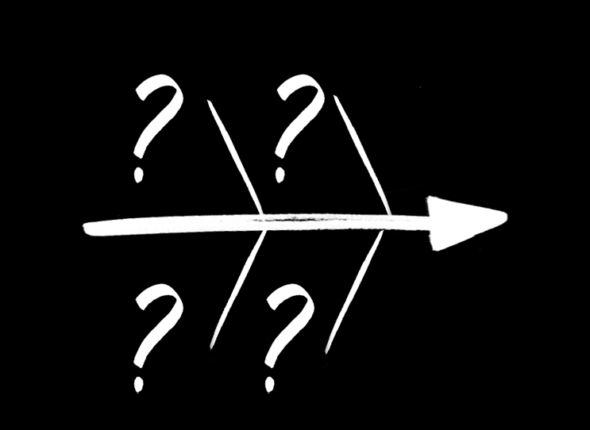
The Ishikawa diagram, also known as the "fishbone" diagram or cause-and-effect diagram, serves as a visual tool to identify and display potential causes of a...
DetailsAFFINITY DIAGRAM
An affinity diagram is a tool that helps simplify and visualise complex information by grouping it according to mutual connections. It involves collecting all relevant...
DetailsUSER STORIES
User stories express individual needs. They are written in the first person and describe what users want to achieve through interaction with a specific product....
DetailsHOW MIGHT WE
We use the How Might We format because it suggests that a solution is possible and because they offer you the chance to answer them...
DetailsEMPATHY MAP
Empathy mapping enables designers to perceive not only the functional aspects but also the emotions involved in user interactions, opening doors to new and innovative...
DetailsJOBS TO BE DONE
The "Jobs-to-be-Done" (JTBD) method is a framework or approach used to understand customer needs and identify problems that are relevant to them. This concept focuses...
Details


